TL;DR: The UMUX-Lite is a short 2-items questionnaire that incorporates the TAM. It has good psychometric properties and can be correlated with the System Usability Scale.
The UMUX-Lite is really a direct descendant of UMUX, it assumes that user acceptance of a new technology is based on its perceived usefulness (Item 2 of the UMUX) and perceived ease of use (Item 3 of the UMUX). Similar to the Technology Acceptance Model.
The Questions: Assessing Usability for User Experience Lite
In order to gauge user acceptance effectively, the UMUX-Lite questionnaire utilises the two positively worded questions of the UMUX. Each question is rated on a 7-point Likert scale, ranging from strongly disagree to strongly agree. The questions used in UMUX-Lite are as follows:
- Usefulness: This system’s capabilities meet my requirements
- Ease of Use: This system is easy to use
The subsequent calculation of the UMUX-Lite score allows for a quantitative evaluation of user experience.
Calculating the UMUX-Lite Score
The UMUX-Lite score serves as a quantitative measure to assess the usability of a system based on user feedback. To calculate the UMUX-Lite score for each user, the following steps are followed:
- Add the scores of the two questions provided by the user.
- Subtract 2 from the total obtained in step 1.
- Multiply the result by 100/12 or 8.33 to normalise the score (bring it on a scale from 0 to 100).
To obtain the UMUX-Lite score for the entire system, the average of all user UMUX scores is calculated. Alternatively, you can use this free tool to automatically calculate the UMUX score.
This system score offers a comprehensive overview of the overall usability from the collective user perspective.
Correlation to SUS: Linking UMUX-Lite and SUS
The UMUX-Lite metric has demonstrated a notable correlation with the widely used System Usability Scale (SUS). Multiple studies have consistently reported correlation coefficients between UMUX-Lite and SUS ranging from 0.74 to 0.83, indicating a strong association between the two metrics. This is quite useful since the SUS, being one of the most thoroughly researched usability questionnaires, comes with a wide variety of benchmarks.
The initial regression formula
Initially, a regression formula was introduced as it seemed to exhibit a stronger correlation with the SUS. The regression formula is calculated as:
UMUX-Liter = 0.65 * (Item1 – Item2 – 2) * (100 / 12) + 22.9.
However, subsequent evidence emerged contradicting the initial claim that the regression formula correlates better with the SUS compared to the original UMUX-Lite calculation.
Multiple studies (for example, Lah et al. and Schrepp et al.) have argued against the predictive quality of this formula; thus, the initial regression formula shouldn’t be preferred over the original UMUX-Lite calculation.
Which formula to use to correlate UMUX-Lite with the SUS
Correlating to SUS using just the Ease question
In this approach, the SUS score is obtained through the equation: (Item2 – 1) * (100 / 6). The idea behind just using the ease-of-use item comes from the initial research of UMUX, where this question was a rephrasing of the SUS’s third question.
Correlating to SUS using the regression equation of the Ease question
The other alternative is to use a regression equation specifically derived from the Ease question. The UMUX-Lite score can be obtained using the equation: 19.2 * ((Item2 – 1) * (4 / 6) + 1) – 2.279. This approach has the highest predictive quality.
Evaluating the Approaches
Both the simple correlation equation and the regression equation exhibit improved results in correlating with the SUS. This is supported by MeasuringU’s unpublished studies, encompassing a diverse range of systems and involving nearly 500 combined participants, and later research by Schrepp et al. Nonetheless, just using the overall UMUX-Lite score as a proxy for the SUS is a straightforward alternative that gives good results.
Alternatives to the first question of UMUX-Lite
In a separate investigation conducted by Lewis and Sauro, alternative formulations were explored to simplify the first question of UMUX-Lite, “This system’s capabilities meet my requirements.” The following alternative statements can be considered as viable alternatives to the original question:
- “{Product}’s functionality meets my needs.”
- “{Product}’s features meet my needs.”
- “{Product}’s functions meet my needs.”
- “{Product} does what I need it to do.”
These alternative statements aim to provide flexibility for picking the question to suit specific research contexts and user populations.
Presenting the UMUX-Lite: Communicating the Metric Effectively
The UMUX-Lite metric can be effectively presented using two distinct approaches: a graphical representation and a grading system.
Graphical Way: Visualising the UMUX-Lite
Not to state the obvious, as with all one-score questionnaires, the system’s overall UMIX-Lite score can be presented using a graph. However, UMUX-Lite offers a unique visualisation opportunity compared to other usability questionnaires. Since it is built to follow the TAM, each question can be presented in its axis to mark the overall usability of the system in the two-dimensional world —quite handy for comparison of different systems.

While nicely presented, there is no evidence that each question is reliably capturing one aspect of usability, so use with caution.
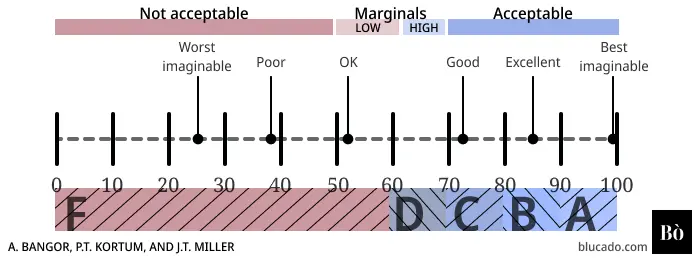
Grading System: Categorising the UMUX-Lite Scores
Since we can approximate an application’s SUS score from the UMUX-Lite, we can use the two grading scales for SUS scores, and all other known benchmarks of SUS scores (e.g., the average SUS score of approximately 500 products in the wild is 68).
A visualisation idea is to calculate the SUS score corresponding to the measured UMUX-Lite score based on one of the correlation formulas on top (or just by using the UMUX-Lite score directly). Then plot the system’s grade based on a grading scale.