TL;DR: The Self-Assessment Manikin (SAM) is a valid and reliable picture-based measurement of perceived emotion. Emotion is measured in three dimensions (Pleasure, Arousal, Dominance), but the Dominance dimension is not usually needed.
But how do we measure emotion? That’s the question the Self-Assessment Manikin (SAM) is answering. More specifically, SAM measures perceived emotion. Emotion measurement dates considerably before Human-Computer Interaction’s existence; naturally, SAM has its roots in psychology and emotion measurement in a psychological context. It was introduced in 1980 by Peter J. Lang. As a matter of fact, a large dataset of studies utilising SAM to measure perceived emotion has used pictures, audio, and nouns (words). However, in measuring aspects of Interaction Experience (IX), we find it useful to also measure perceived emotion (for example).
Setting up the SAM
The questions of SAM
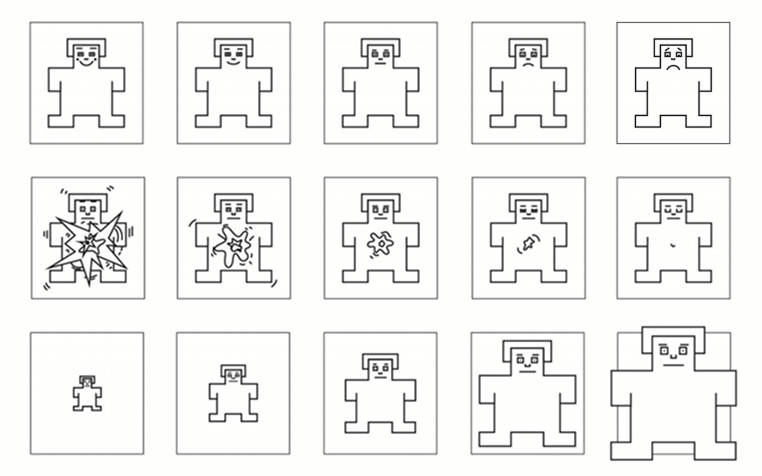
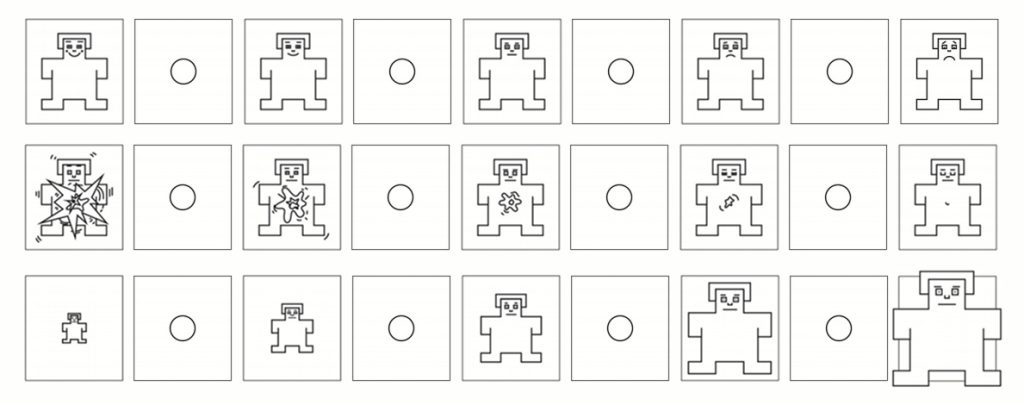
The Self-Assessment Manikin is different from the questionnaires we normally use in IX measurement in that it consists of pictures. Five pictures and a blank space in between them that represents the in-the-middle values are organised in a 3-row format; each line is one dimension: Pleasure, Arousal and Dominance. There is also a variant (the original version) that includes only 5 pictures per line, without the in-the-middle boxes.
- The first line measures pleasure (valence): from (left) feeling very happy, to (right) feeling very unhappy. (This is the initial ordering of items, although some publications use the reverse order)
- The second line measures arousal (how strong the feeling is): from (left) a very tense feeling to (right) a very calm feeling. (Once again, this is the initial ordering of items, although some publications use the reverse order)
- The third line measures dominance: from (left) submissiveness to (right) dominance


The responses of SAM
Participants can rate their affective state (emotion) by placing an X in one box per line.
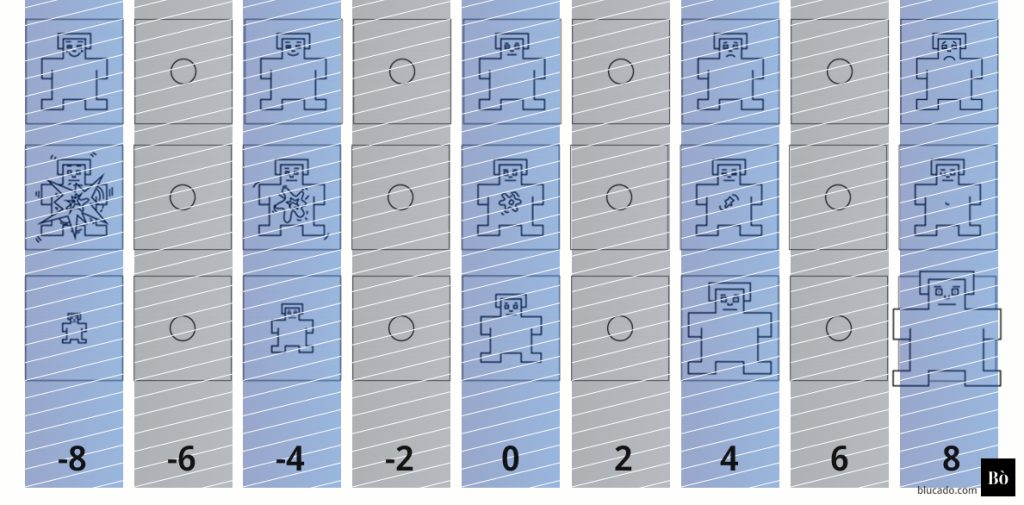
In analysis, the leftmost manikin is coded with the number -8 and moving to the box on its right adds 2. So the equivalent numerical values for each dimension (with in-the-middle values) are: -8, -6, -4, -2, 0, 2, 4, 6, and 8.
- For the first line, pleasure, -8 represents a very happy feeling, 0 represents feeling neither happy nor unhappy, and 8 represents a very unhappy feeling
- For the second line, arousal, -8 represents a very tense feeling, 0 represents a feeling neither tense nor calm, and 8 represents a very calm feeling
- For the third line, dominance, -8 represents a very submissive feeling, 0 represents neither a dominant nor a submissive feeling, and 8 represents a very dominant feeling
The participants don’t see the numbers; we only use them to code the responses for analysis.

Calculating the SAM score
Given that there is no single SAM score, we interpret the three replies of each participant as a triple that describes the perceived affective state in a three-dimensional plane.
So, calculating the score for the emotional response that an interaction with a system, product, or service elicits is a matter of averaging all replies for each of the dimensions, not forgetting to also state standard errors. We can also use statistical analysis tools to automate the process (for example, IX Calculator offers both the original three-dimensional, and the current two-dimensional version). Then we interpret the results using the equivalence between the numbers and the affective state for each dimension (above).
For example, if we have the replies of 50 participants after an interaction with a product, and we calculate the averages as: average(Pleasure) = -6.4, average(Arousal) = -4.5 and average(Dominance) = 1.0, we can interpret it as that the product, on average, was very pleasurable to use, arousing, and that participants felt dominant during their use.
The Dominance dimension is not needed
Since 1980, there has been substantial development in how emotion, or more accurately, core affect, can be represented. Although SAM was based on Russell’s and Mehrabian’s theory of Pleasure, Arousal, Dominance (PAD), later Russell clarified that core affect can be represented fully by just two dimensions (Pleasure and Arousal), which is also the case in frontier emotion construction theories.
So, the SAM can be administered and analysed by just the first two lines measuring Pleasure and Arousal, dropping completely the Dominance dimension.
Reliability, validity, and properties of SAM
In the last almost half a century, SAM has shown good psychometric properties. Test-retest reliability was very high (r = .96–.98). At the same time, Pleasure and Arousal dimensions showed high correlations with the Semantic Differential Scale and demonstrated high agreement between participants.
The distribution of emotions in a two-dimensional space
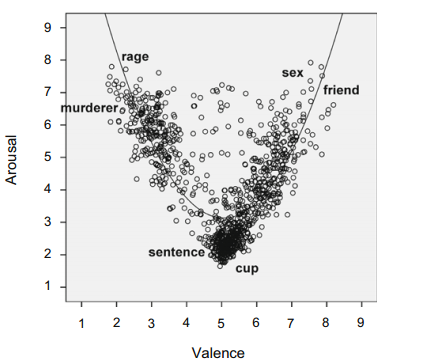
Even though all numerical combinations of Pleasure–Arousal are theoretically possible, in practice, measured emotion appears as a U-curve when plotted on a Pleasure-Arousal space and can be modelled with a quadratic function. That highlights the difficulty of the appearance of emotions that are felt as either very happy and very calm, or very unhappy and very calm. At the same time, emotions that are considered very calm tend to be neutral in terms of pleasure.
